As I mentioned in my essential list of tools for the .NET developer, I have two VS extensions that I rely on more than any – ReSharper and OzCode. Since ReSharper has already captured the imaginations of most .NET devs who have an Internet connection, I thought it only fair to write about one of the best, most polished and most useful plugins I’ve ever used right out of the box – OzCode – which takes debugging in Visual Studio to the next level.
I’ve often thought that the debugging experience in VS could use a facelift – it’s essentially the same as it was years and years ago (think QuickBASIC) with some niceties added on. Enter OzCode to make all of our lives easier. It’s hard to explain how it’s useful without showing you, so I’ll just jump right in and talk about my four favorite features – all with helpful visuals!
Reveal
Easily the feature I use the most, Reveal allows you to “favorite” properties on objects, which puts those properties front and center when inspecting an object, either by hovering over it or using the Watch window. Both methods typically display the result of its ToString() method, which isn’t usually overloaded by objects – Reveal makes that irrelevant by allowing you to display the properties you want to see. Very useful when inspecting lists!

Magic Glance
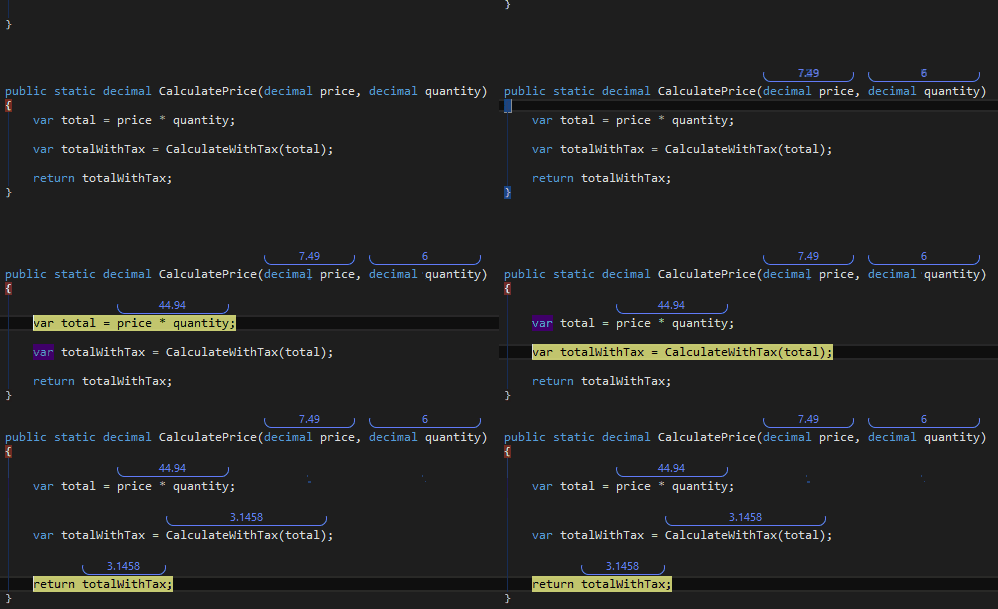
Magic Glance gives you a heads-up display that displays the values of the parameters and variables within a method’s scope. We’ve all spent time hovering over variable names or adding variables to the Watch window, attempting to get values for those variables in the middle of debugging. Magic Glance takes the need for this away – it displays the value of the variables inline with your code while you’re debugging. It even displays information you’ve selected using the Reveal feature!

Exception Trail
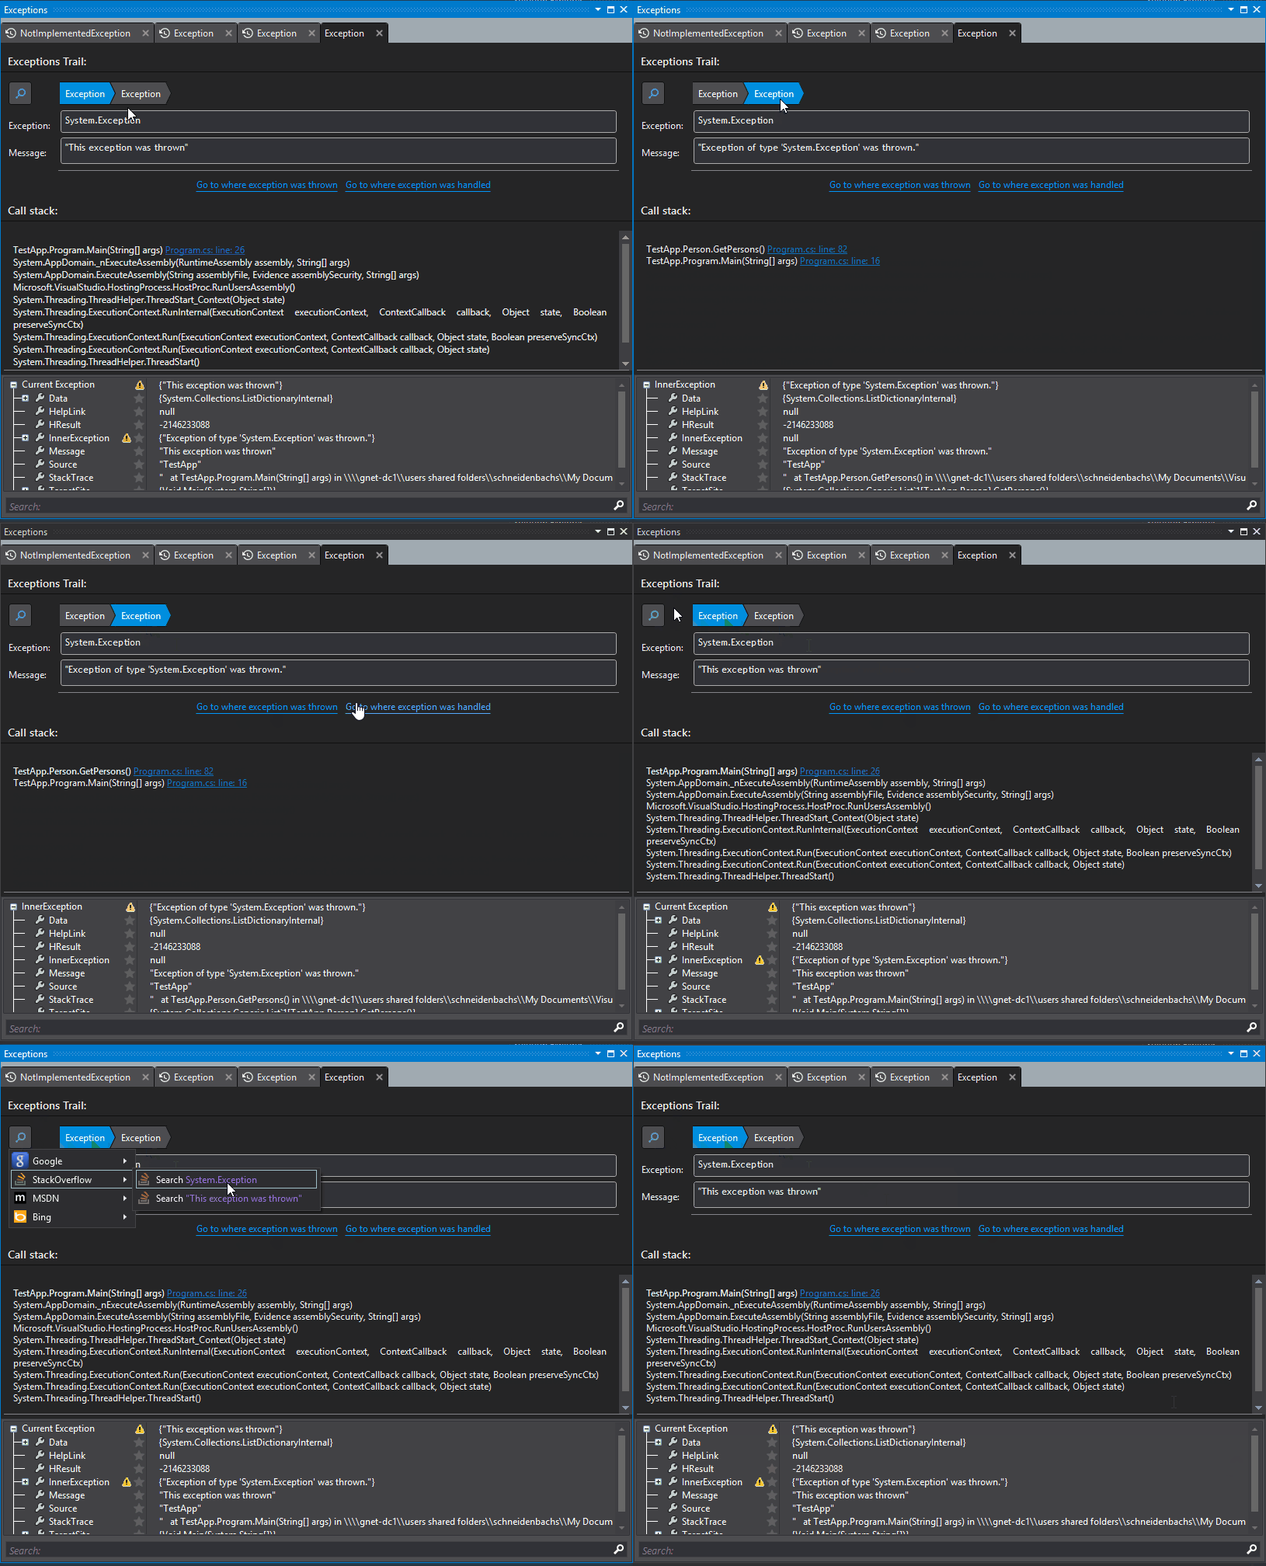
Exception trail gives you a nice heads-up display when an exception is thrown, which is much nicer than the one baked into Visual Studio. It displays each previous exception thrown in a tab so you can click back through them, and you can even click and go to the line of code where the exception was thrown (and handled, if applicable.) If there are multiple exceptions caught and thrown in different layers of your application, the exceptions display in a chain, allowing you to click through them. You can even immediately click and search for that exception in Google and StackOverflow!

Search/Filter
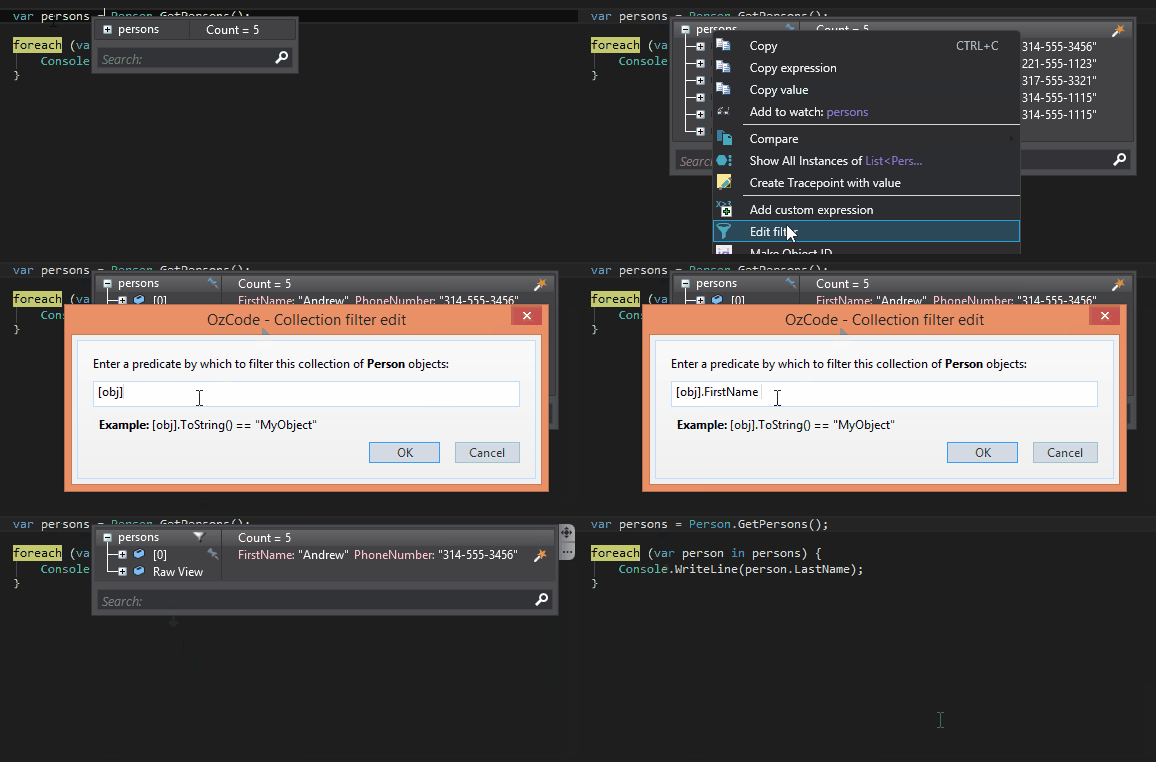
On more than one occasion, I’ve inspected a list of objects in the debugger looking for an object or objects with a property that has a specific value. Though the Reveal feature already makes this easier, Search and Filter take it even further, allowing you to easily look for the objects you want to inspect, either by using a filter with a predicate or a search box.
Search will take whatever you input in the search box and look for properties that closely match what you’ve searched. It searches only through the first few “layers” of objects to keep it speedy, but you can search more layers if you want.

Filter is useful as well – you can enter a predicate and the list of objects you’re looking at will be reduced to the ones that match that predicate.

Conclusion
Anyways, not much else to say except that this product is a steal for $79 (for the individual developer) or $149/seat for businesses, with discounts after the first license. Check it out with a 30-day free trial! It’s saved me lots of time debugging and has even made it… fun? Against all odds…
Disclaimer: I received a free copy of OzCode in exchange for my honest opinions about the software.


